Jakarta Through Water's Lens | Data-Driven Dashboard for Sustainable Water Management
Text-to-Video
B2C Video Clip Tool Powered by Gen AI
Jakarta Through Water's Lens | Data-Driven Dashboard for Sustainable Water Management
This data visualization project transforms complex water distribution and consumption data in DKI Jakarta into actionable insights. By analyzing patterns in supply, demand, pipe water coverage, and groundwater reliance at regional, district, and subdistrict levels, the dashboard empowers businesses, policymakers, and residents to make informed decisions for sustainable water resource management.
This data visualization project transforms complex water distribution and consumption data in DKI Jakarta into actionable insights. By analyzing patterns in supply, demand, pipe water coverage, and groundwater reliance at regional, district, and subdistrict levels, the dashboard empowers businesses, policymakers, and residents to make informed decisions for sustainable water resource management.
This data visualization project transforms complex water distribution and consumption data in DKI Jakarta into actionable insights. By analyzing patterns in supply, demand, pipe water coverage, and groundwater reliance at regional, district, and subdistrict levels, the dashboard empowers businesses, policymakers, and residents to make informed decisions for sustainable water resource management.
Data Visualization
Data Visualization
Data Visualization
UXUI
UXUI
UXUI
Product Design
Product Design
Product Design
Fall 2024
Fall 2024
Fall 2024
My role
Product Designer
Academic project at Harvard University
Product Designer
Academic project at Harvard University
Product Designer
Academic project at Harvard University
What I did
Product design, UXUI, Data visualization, Data analysis, Research, Storyboarding, Wireframing, Prototyping
Product design, UXUI, Data visualization, Data analysis, Research, Storyboarding, Wireframing, Prototyping
Product design, UXUI, Data visualization, Data analysis, Research, Storyboarding, Wireframing, Prototyping
Collaboration
Diksha Chugh - Software Engineer
Diksha Chugh - Software Engineer
Diksha Chugh - Software Engineer
Duration
6 weeks, Fall 2024
6 weeks, Fall 2024
6 weeks, Fall 2024
Research
Over 60% of people In Jakarta rely on groundwater as a primary water source. This is the primary driver of the city's land subsidence.
Over 60% of people In Jakarta rely on groundwater as a primary water source. This is the primary driver of the city's land subsidence.
Over 60% of people In Jakarta rely on groundwater as a primary water source. This is the primary driver of the city's land subsidence.
Because
Because
Because
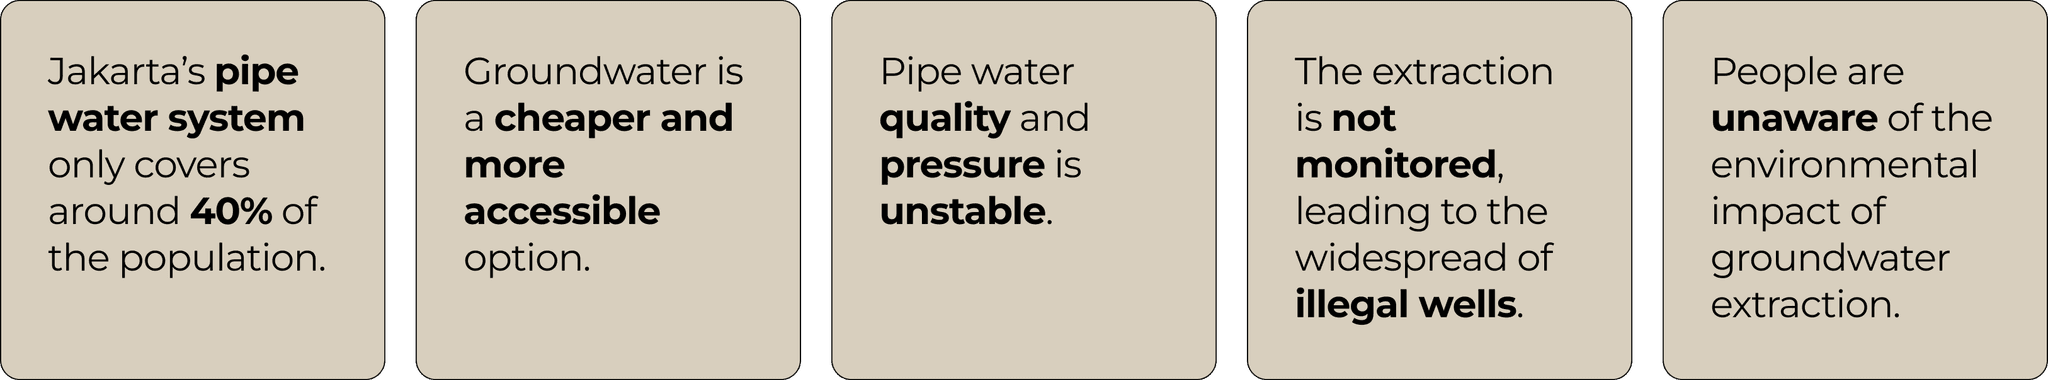
Jakarta’s pipe water system serves only 40% of the population, leaving most residents reliant on groundwater due to its affordability and accessibility. Poor regulation has allowed illegal wells to proliferate, further depleting aquifers. As groundwater levels drop, residents dig deeper, worsening land subsidence and creating a destructive cycle that threatens the city’s future.
Jakarta’s pipe water system serves only 40% of the population, leaving most residents reliant on groundwater due to its affordability and accessibility. Poor regulation has allowed illegal wells to proliferate, further depleting aquifers. As groundwater levels drop, residents dig deeper, worsening land subsidence and creating a destructive cycle that threatens the city’s future.
Jakarta’s pipe water system serves only 40% of the population, leaving most residents reliant on groundwater due to its affordability and accessibility. Poor regulation has allowed illegal wells to proliferate, further depleting aquifers. As groundwater levels drop, residents dig deeper, worsening land subsidence and creating a destructive cycle that threatens the city’s future.
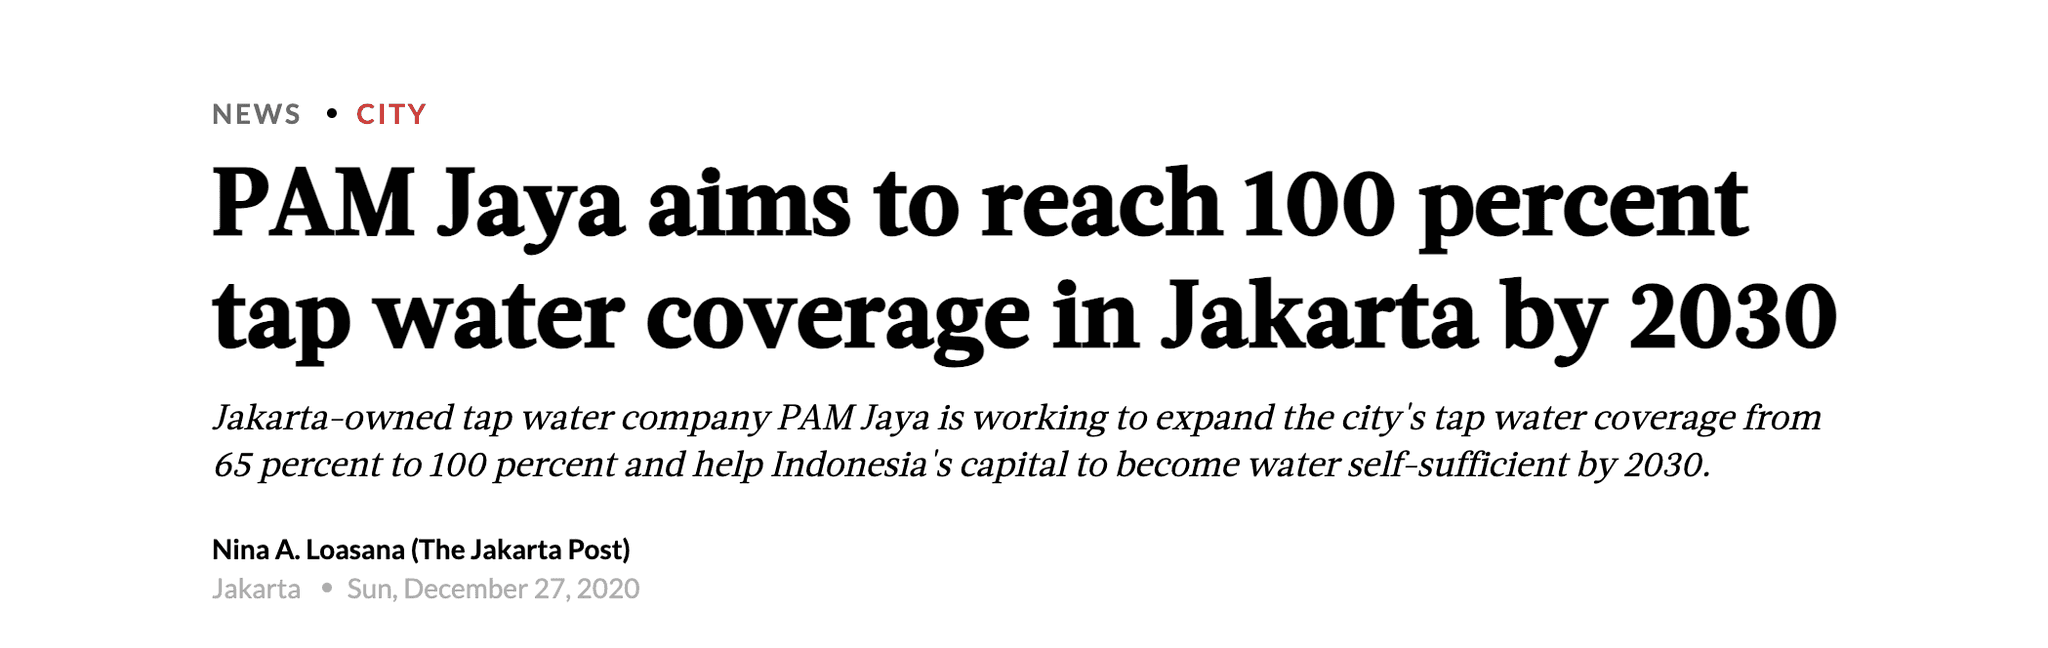
The government plans to achieve 100% pipe water coverage by 2030. However, high costs, slow progress, and public distrust of pipe water quality persist. Many residents with access to piped water still rely on groundwater, highlighting the need for a deeper understanding of water usage behaviors and influencing factors.
The government plans to achieve 100% pipe water coverage by 2030. However, high costs, slow progress, and public distrust of pipe water quality persist. Many residents with access to piped water still rely on groundwater, highlighting the need for a deeper understanding of water usage behaviors and influencing factors.
The government plans to achieve 100% pipe water coverage by 2030. However, high costs, slow progress, and public distrust of pipe water quality persist. Many residents with access to piped water still rely on groundwater, highlighting the need for a deeper understanding of water usage behaviors and influencing factors.
Jakarta’s pipe water system serves only 40% of the population, leaving most residents reliant on groundwater due to its affordability and accessibility. Poor regulation has allowed illegal wells to proliferate, further depleting aquifers. As groundwater levels drop, residents dig deeper, worsening land subsidence and creating a destructive cycle that threatens the city’s future.
Jakarta’s pipe water system serves only 40% of the population, leaving most residents reliant on groundwater due to its affordability and accessibility. Poor regulation has allowed illegal wells to proliferate, further depleting aquifers. As groundwater levels drop, residents dig deeper, worsening land subsidence and creating a destructive cycle that threatens the city’s future.
Jakarta’s pipe water system serves only 40% of the population, leaving most residents reliant on groundwater due to its affordability and accessibility. Poor regulation has allowed illegal wells to proliferate, further depleting aquifers. As groundwater levels drop, residents dig deeper, worsening land subsidence and creating a destructive cycle that threatens the city’s future.
Yes
Yes
But…
But…
Context
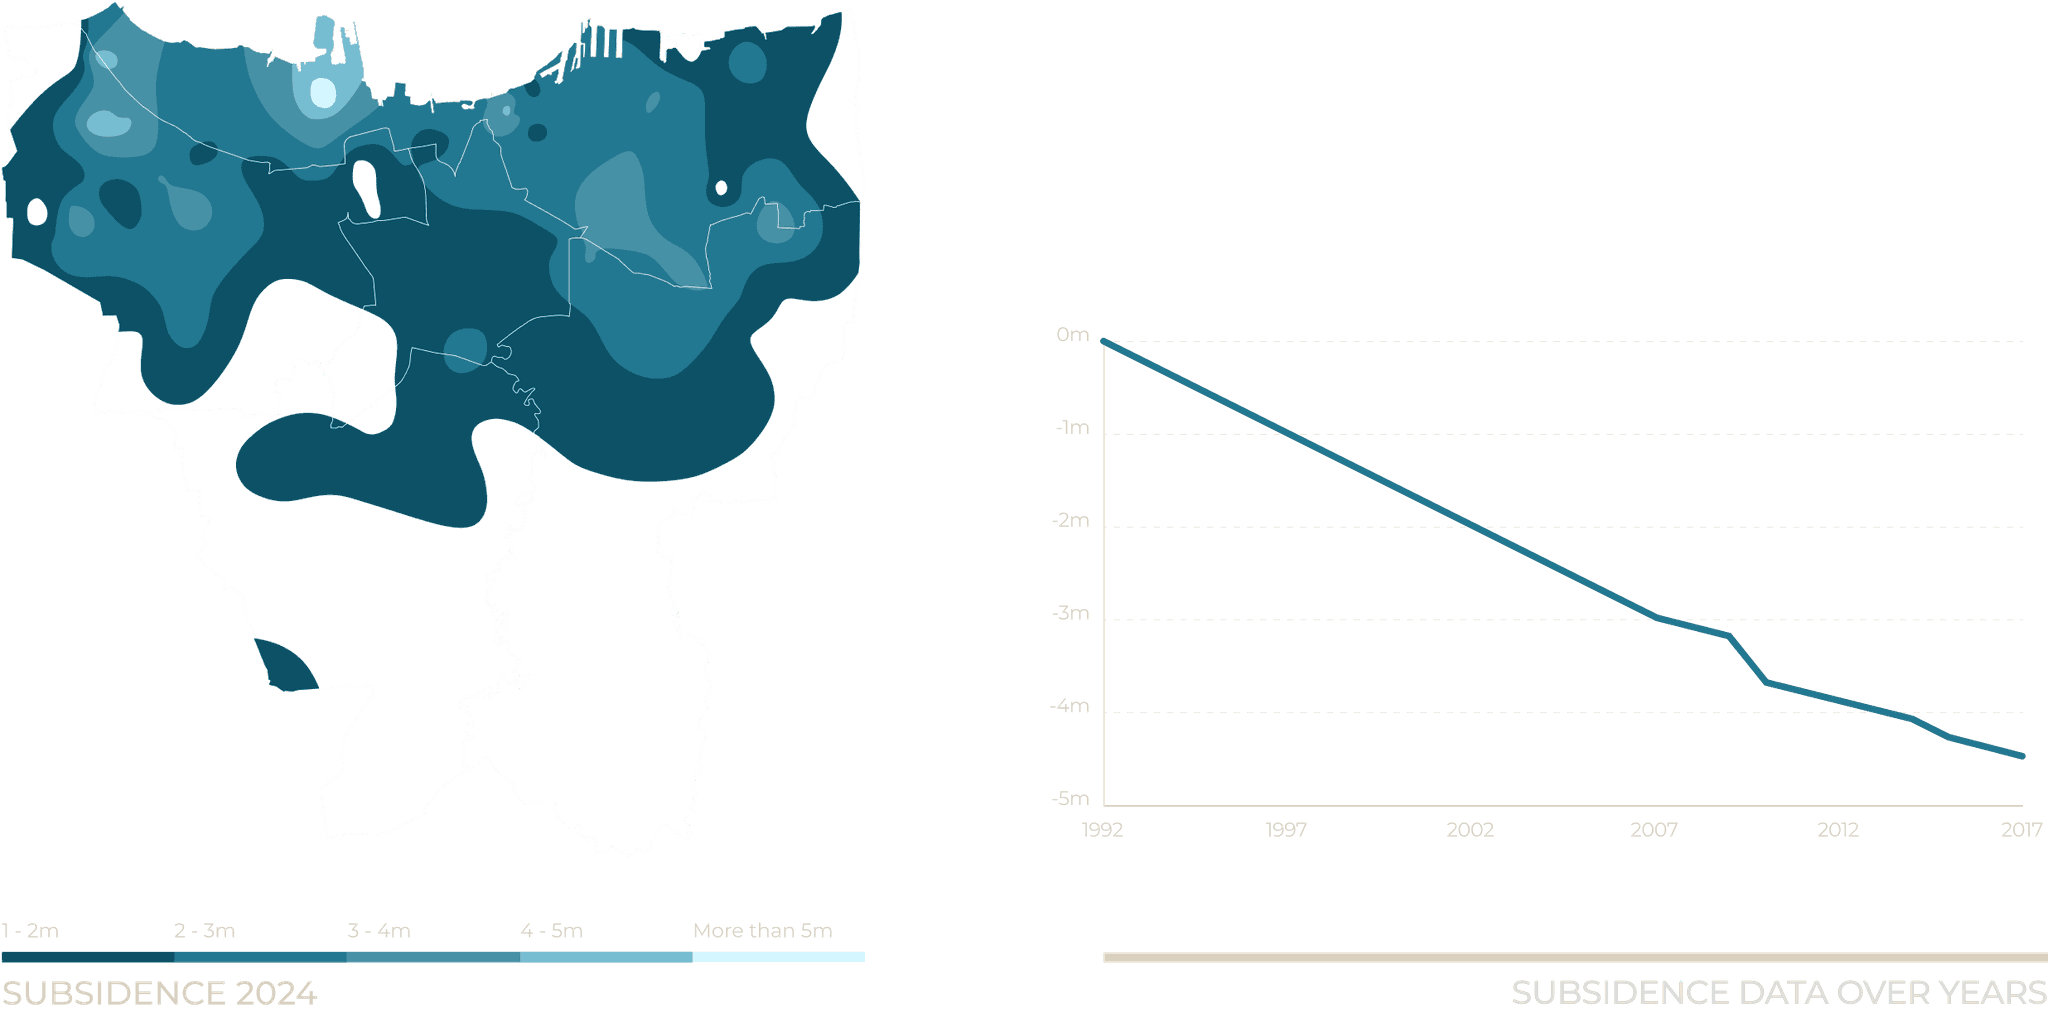
Jakarta is the fastest sinking city in the world.
By 2050, 50% of Jakarta will be underwater during high tides.
Jakarta is the fastest sinking city in the world.
By 2050, 50% of Jakarta will be underwater during high tides.
Jakarta is the fastest sinking city in the world.
By 2050, 50% of Jakarta will be underwater during high tides.
Jakarta’s rapid urbanization, poor water management, and unregulated groundwater extraction are fueling a sinking crisis. As a densely populated coastal city, it faces rising flood risks, failing infrastructure, and mounting challenges tied to its geography and water dependency.
Jakarta’s rapid urbanization, poor water management, and unregulated groundwater extraction are fueling a sinking crisis. As a densely populated coastal city, it faces rising flood risks, failing infrastructure, and mounting challenges tied to its geography and water dependency.
Jakarta’s rapid urbanization, poor water management, and unregulated groundwater extraction are fueling a sinking crisis. As a densely populated coastal city, it faces rising flood risks, failing infrastructure, and mounting challenges tied to its geography and water dependency.
How do human activities accelerate land subsidence?
How do human activities accelerate land subsidence?
How do human activities accelerate land subsidence?
Land subsidence is the gradual sinking of the ground’s surface due to a loss of structural support beneath the earth. Human activities play a significant role in accelerating subsidence through:
Land subsidence is the gradual sinking of the ground’s surface due to a loss of structural support beneath the earth. Human activities play a significant role in accelerating subsidence through:
Land subsidence is the gradual sinking of the ground’s surface due to a loss of structural support beneath the earth. Human activities play a significant role in accelerating subsidence through:

Sea Level Rise
Sea Level Rise
Accelerated by climate change, rising sea levels increase pressure on low-lying land, exacerbating subsidence.

Rapid Urbanization
Rapid Urbanization
Expanding cities add weight to the land, disrupt natural water absorption, and limit groundwater recharge.
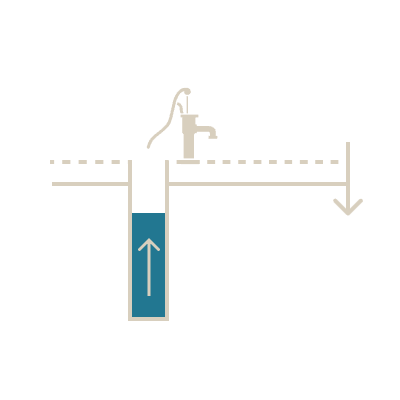
Groundwater Over-extraction
Groundwater Over-extraction
Excessive pumping of underground aquifers weakens the soil and rock layers, causing the ground to sink.
Problem
Which areas in Jakarta need the most attention based on how people use water and what factors influence their choice of water sources?
Which areas in Jakarta need the most attention based on how people use water and what factors influence their choice of water sources?
Which areas in Jakarta need the most attention based on how people use water and what factors influence their choice of water sources?
Solution
I designed a web-based tool that bridges the gap between data, community voices, and actionable insights to empower decision-makers and residents to take targeted action to solve water-related challenges.
I designed a web-based tool that bridges the gap between data, community voices, and actionable insights to empower decision-makers and residents to take targeted action to solve water-related challenges.
I designed a web-based tool that bridges the gap between data, community voices, and actionable insights to empower decision-makers and residents to take targeted action to solve water-related challenges.
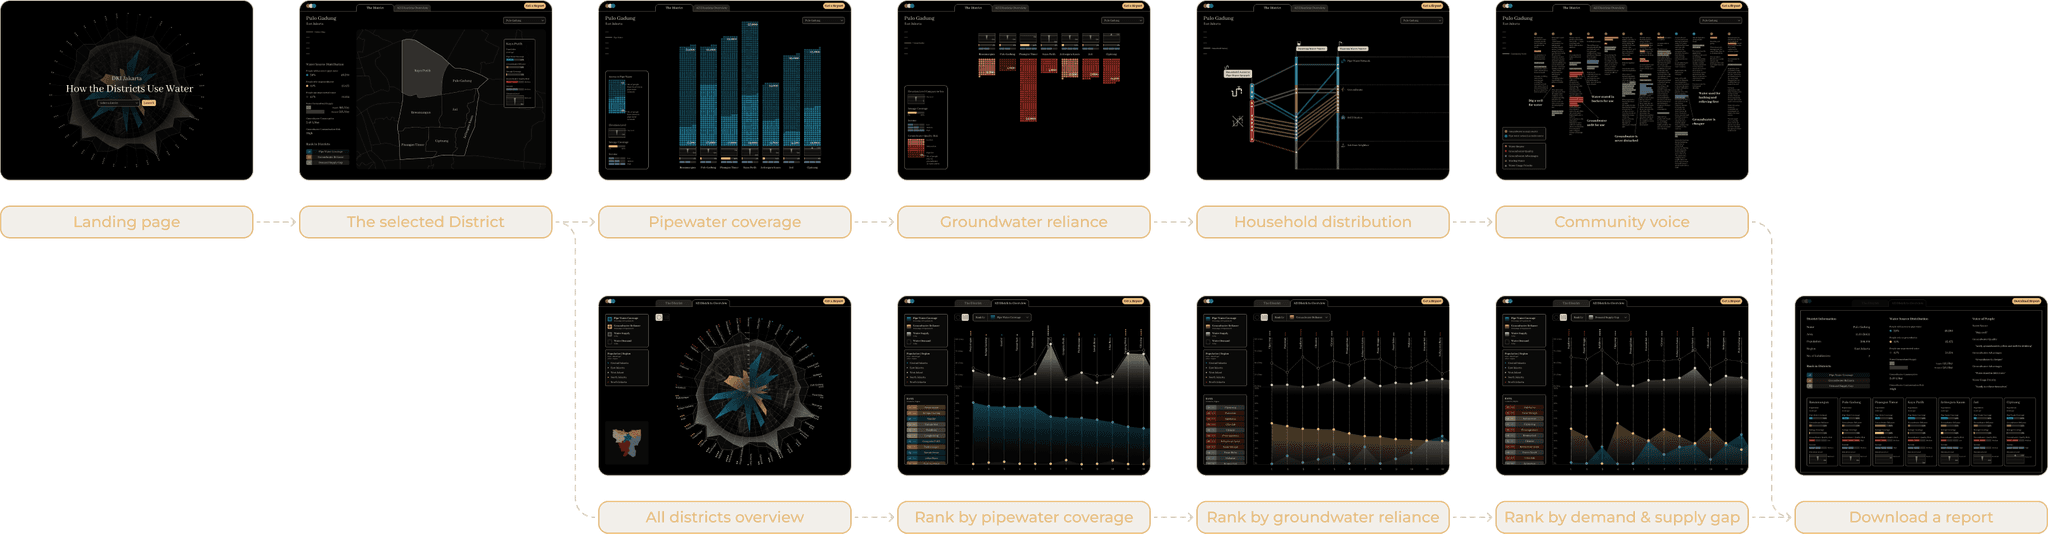
An interactive web-based platform designed to help users visualize data and explore key patterns driving subsidence, water use, and community needs.
An interactive web-based platform designed to help users visualize data and explore key patterns driving subsidence, water use, and community needs.
An interactive web-based platform designed to help users visualize data and explore key patterns driving subsidence, water use, and community needs.
District & Subdistrict
An interactive district map allows users to navigate and compare key data across subdistricts seamlessly.
An interactive district map allows users to navigate and compare key data across subdistricts seamlessly.
An interactive district map allows users to navigate and compare key data across subdistricts seamlessly.
This map allows users to explore and compare subdistrict data, including pipe water coverage, groundwater reliance, water demand and supply, and risk levels. Hovering reveals metrics like sewage coverage, income, and elevation, supporting informed decisions.
This map allows users to explore and compare subdistrict data, including pipe water coverage, groundwater reliance, water demand and supply, and risk levels. Hovering reveals metrics like sewage coverage, income, and elevation, supporting informed decisions.
This map allows users to explore and compare subdistrict data, including pipe water coverage, groundwater reliance, water demand and supply, and risk levels. Hovering reveals metrics like sewage coverage, income, and elevation, supporting informed decisions.
Bar charts provide a clear breakdown of key metrics, enabling users to explore detailed patterns and visualize data intuitively.
Bar charts provide a clear breakdown of key metrics, enabling users to explore detailed patterns and visualize data intuitively.
Bar charts provide a clear breakdown of key metrics, enabling users to explore detailed patterns and visualize data intuitively.
This page visualizes key metrics across subdistricts making data easy to interpret and vulnerabilities clear.
This page visualizes key metrics across subdistricts making data easy to interpret and vulnerabilities clear.
This page visualizes key metrics across subdistricts making data easy to interpret and vulnerabilities clear.
Household water usage data differentiates between purposes, revealing patterns and key dependencies.
Household water usage data differentiates between purposes, revealing patterns and key dependencies.
Household water usage data differentiates between purposes, revealing patterns and key dependencies.
This page visualizes household water usage patterns, highlighting water source choices for different purposes based on regional survey data.
This page visualizes household water usage patterns, highlighting water source choices for different purposes based on regional survey data.
This page visualizes household water usage patterns, highlighting water source choices for different purposes based on regional survey data.
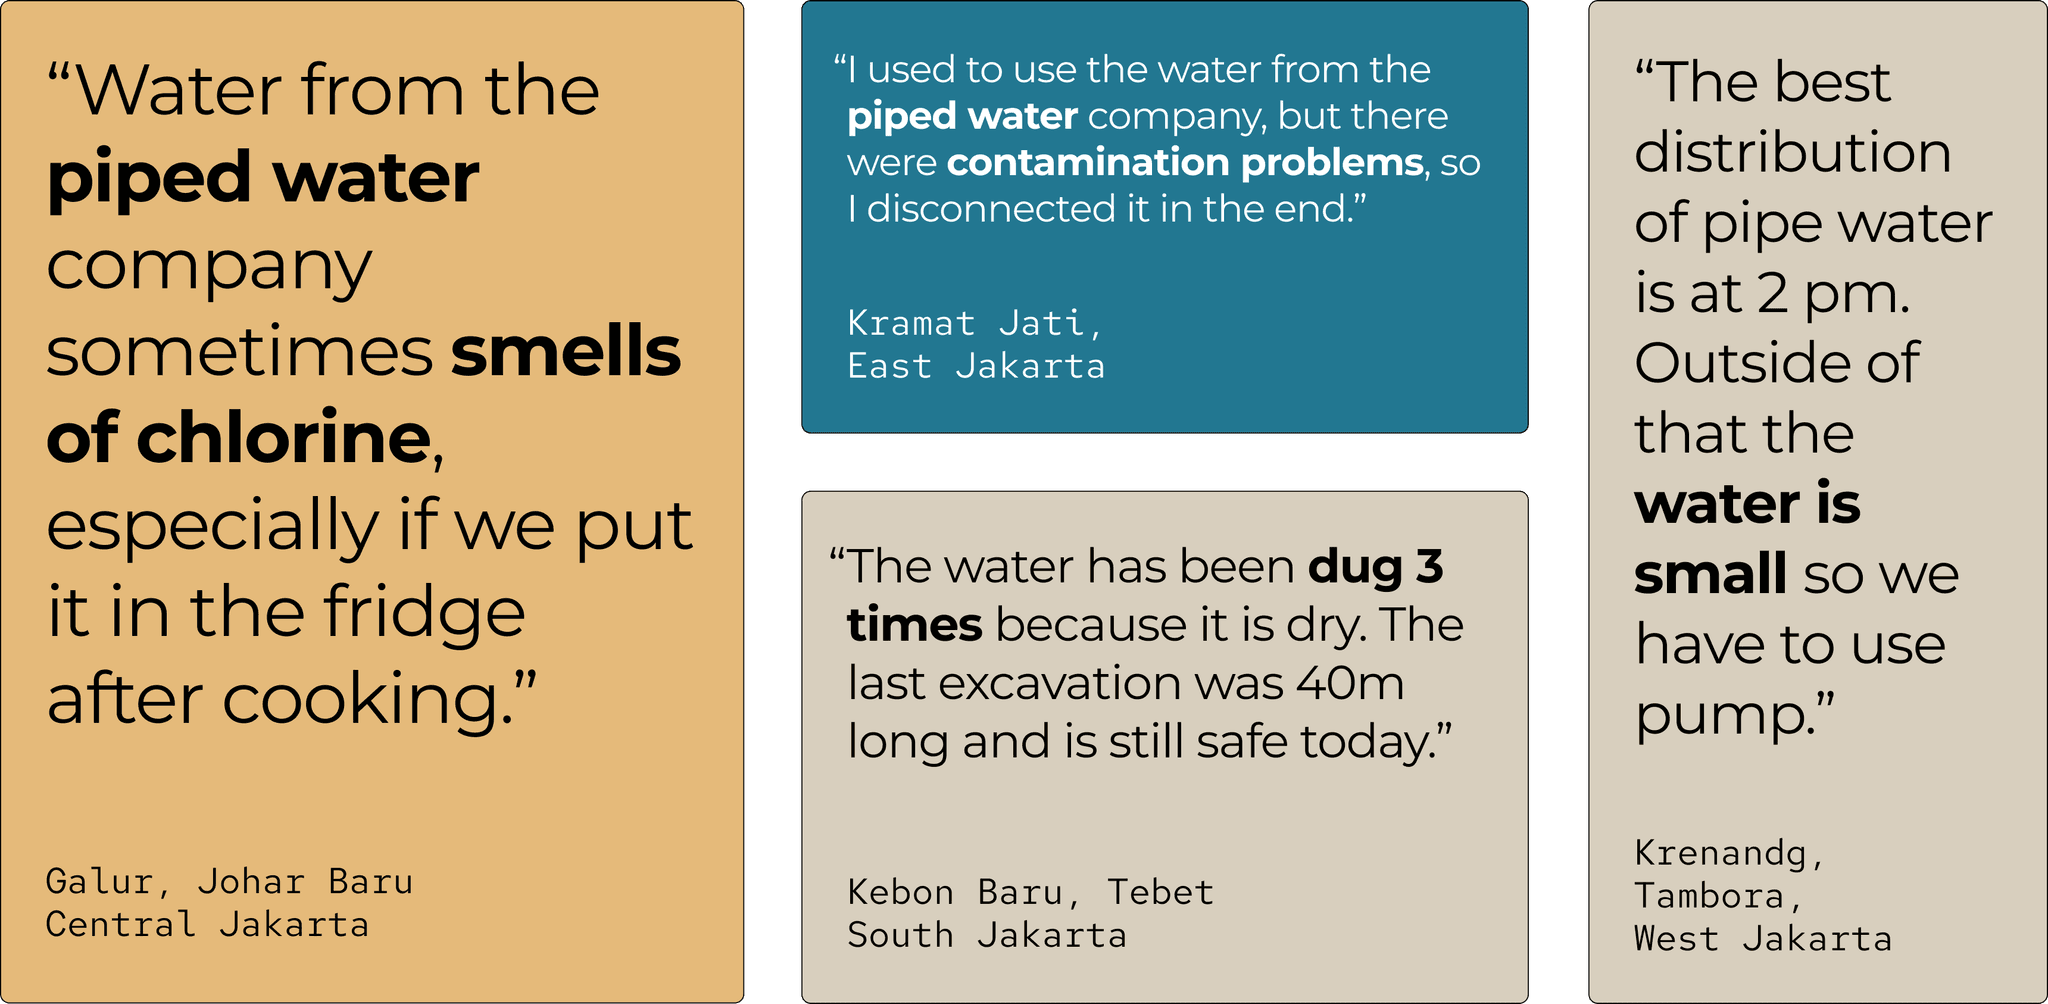
Community voices reveal valuable insights. Highlighted keywords help users uncover patterns and priorities.
Community voices reveal valuable insights. Highlighted keywords help users uncover patterns and priorities.
Community voices reveal valuable insights. Highlighted keywords help users uncover patterns and priorities.
This page visualizes household opinions on water, highlighting key themes such as water sources, groundwater quality, advantages, storage practices, and usage priorities. The design enables users to identify community needs and preferences quickly.
This page visualizes household opinions on water, highlighting key themes such as water sources, groundwater quality, advantages, storage practices, and usage priorities. The design enables users to identify community needs and preferences quickly.
This page visualizes household opinions on water, highlighting key themes such as water sources, groundwater quality, advantages, storage practices, and usage priorities. The design enables users to identify community needs and preferences quickly.
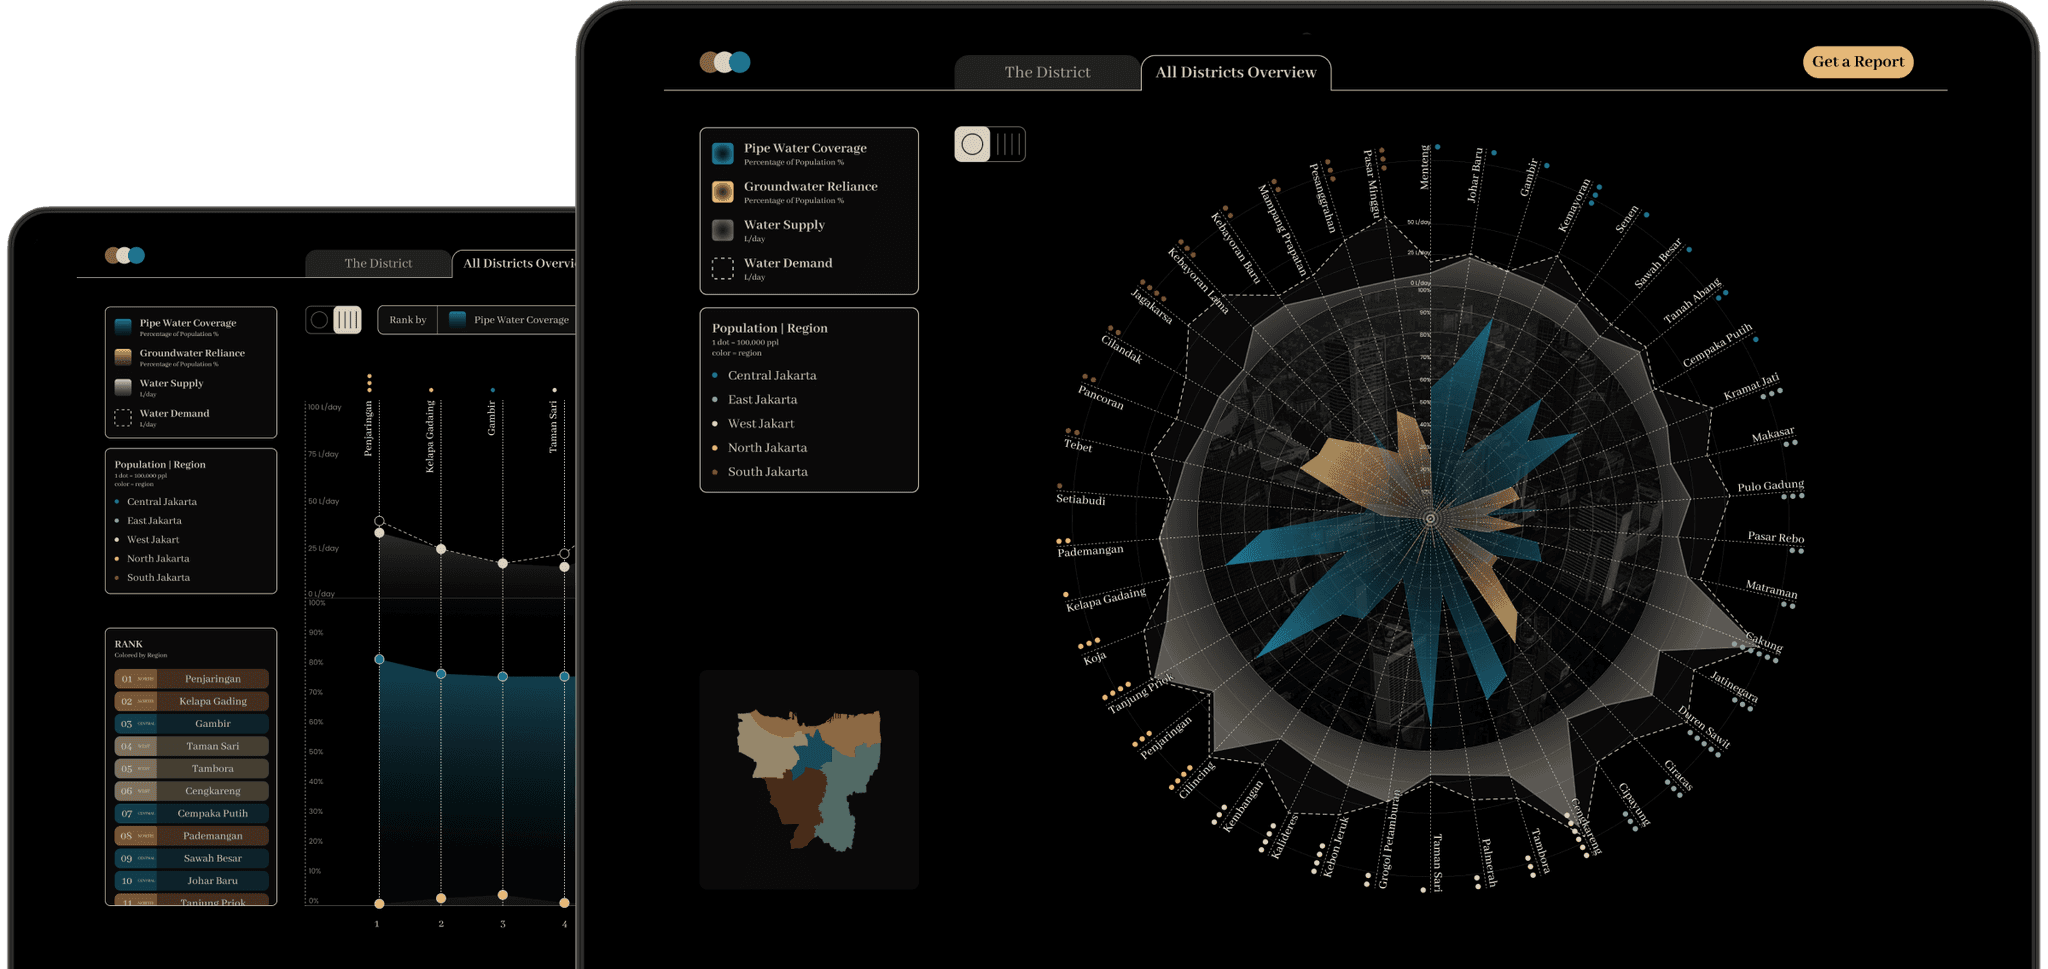
Region & All Districts
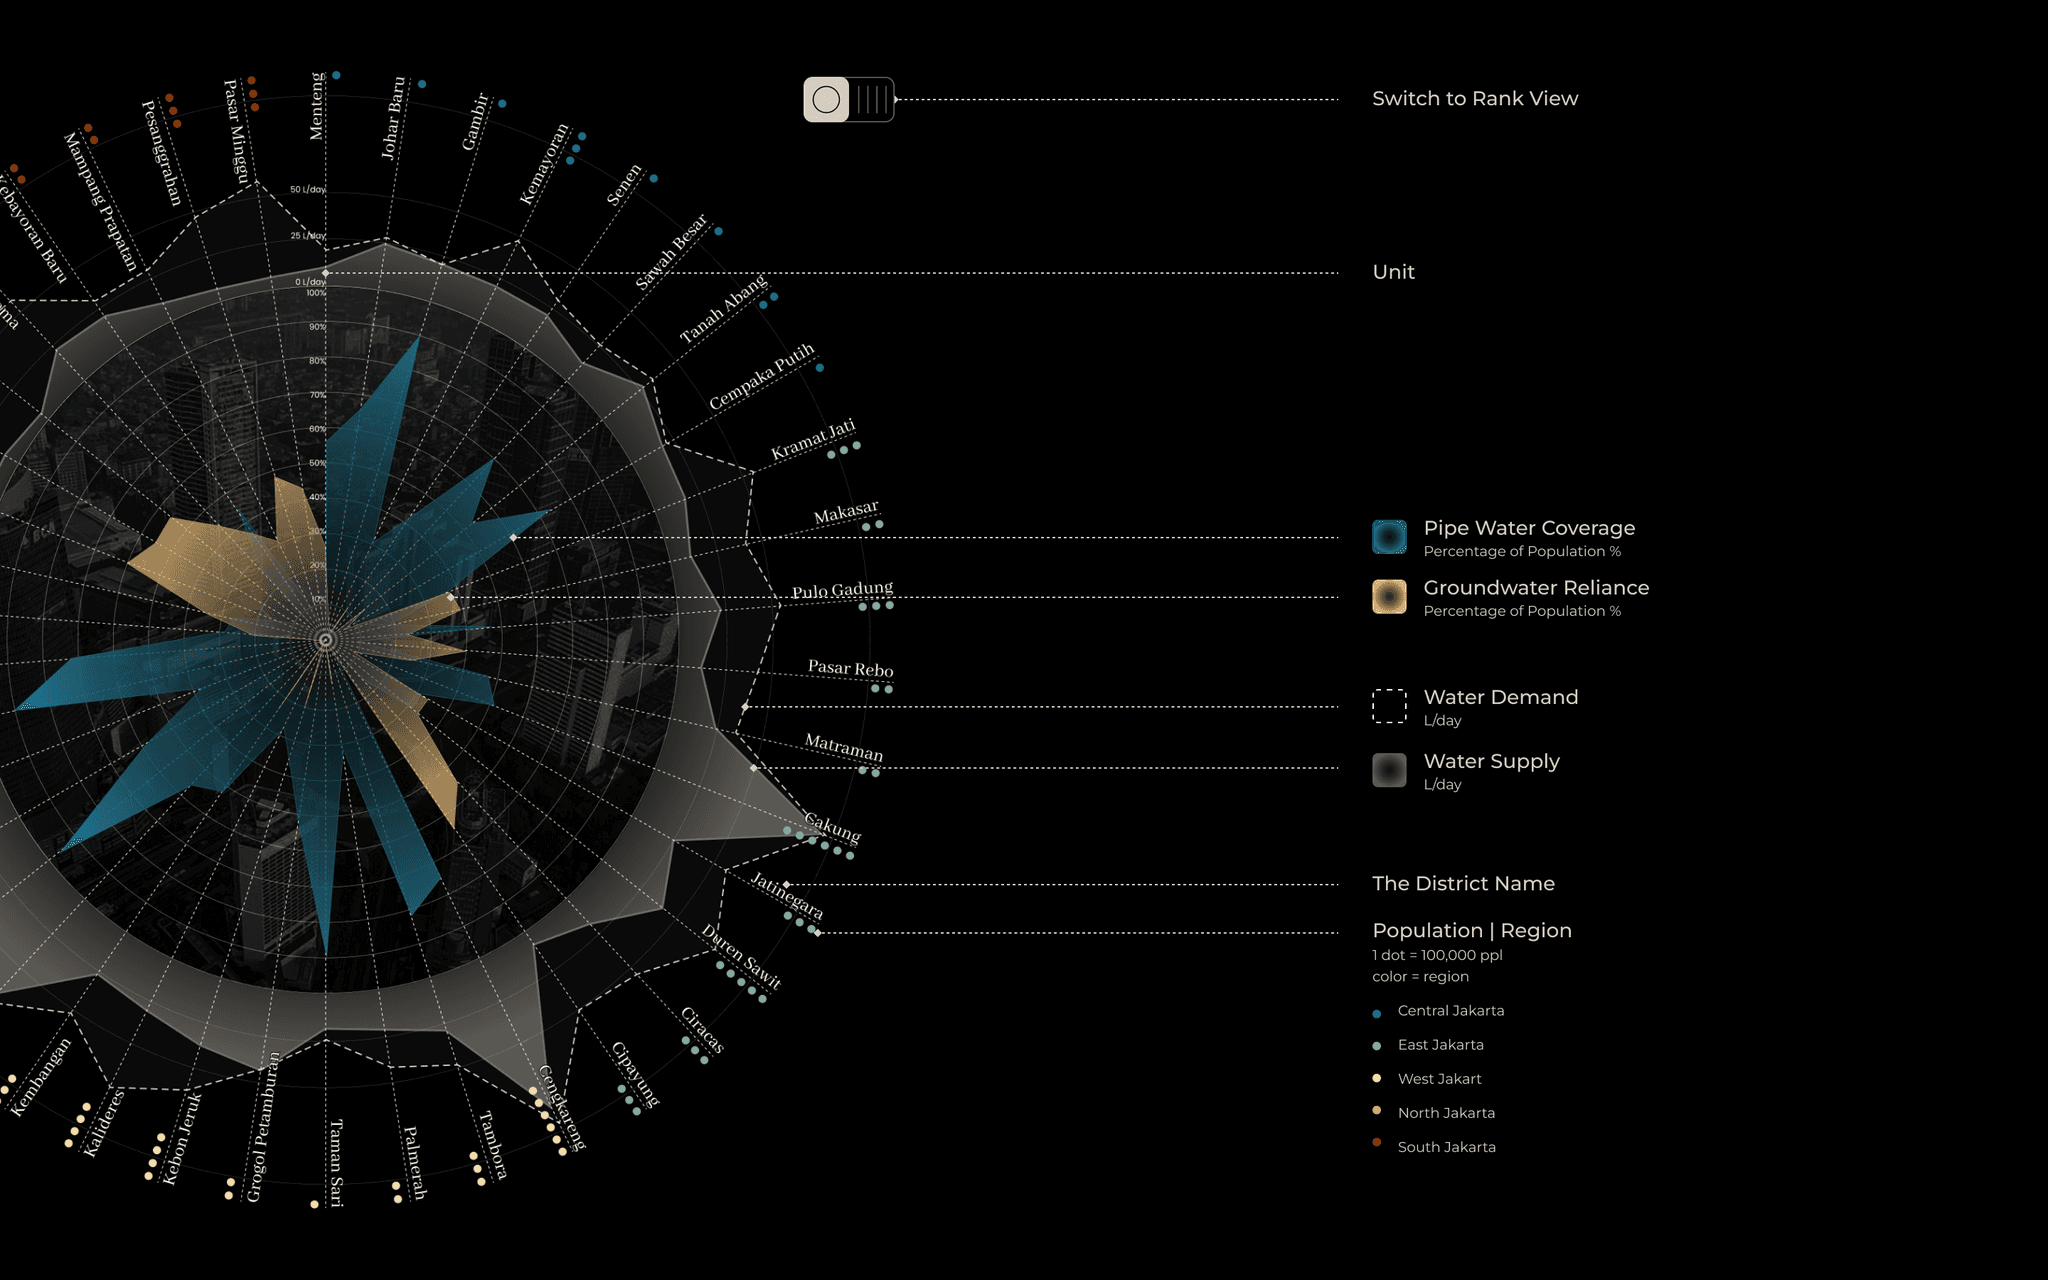
Ranking, comparison, and sorting provide users with clear insights into district-level conditions within a regional context.
Users can seamlessly toggle between radial and ranked line chart views.
Ranking, comparison, and sorting provide users with clear insights into district-level conditions within a regional context.
Users can seamlessly toggle between radial and ranked line chart views.
Ranking, comparison, and sorting provide users with clear insights into district-level conditions within a regional context.
Users can seamlessly toggle between radial and ranked line chart views.
Each radial represents a district, sorted and color-coded by region. The visualization highlights correlations between factors at both district and regional levels. Hovering over a district reveals specific data and its rank, offering users precise and actionable insights.
Each radial represents a district, sorted and color-coded by region. The visualization highlights correlations between factors at both district and regional levels. Hovering over a district reveals specific data and its rank, offering users precise and actionable insights.
Each radial represents a district, sorted and color-coded by region. The visualization highlights correlations between factors at both district and regional levels. Hovering over a district reveals specific data and its rank, offering users precise and actionable insights.
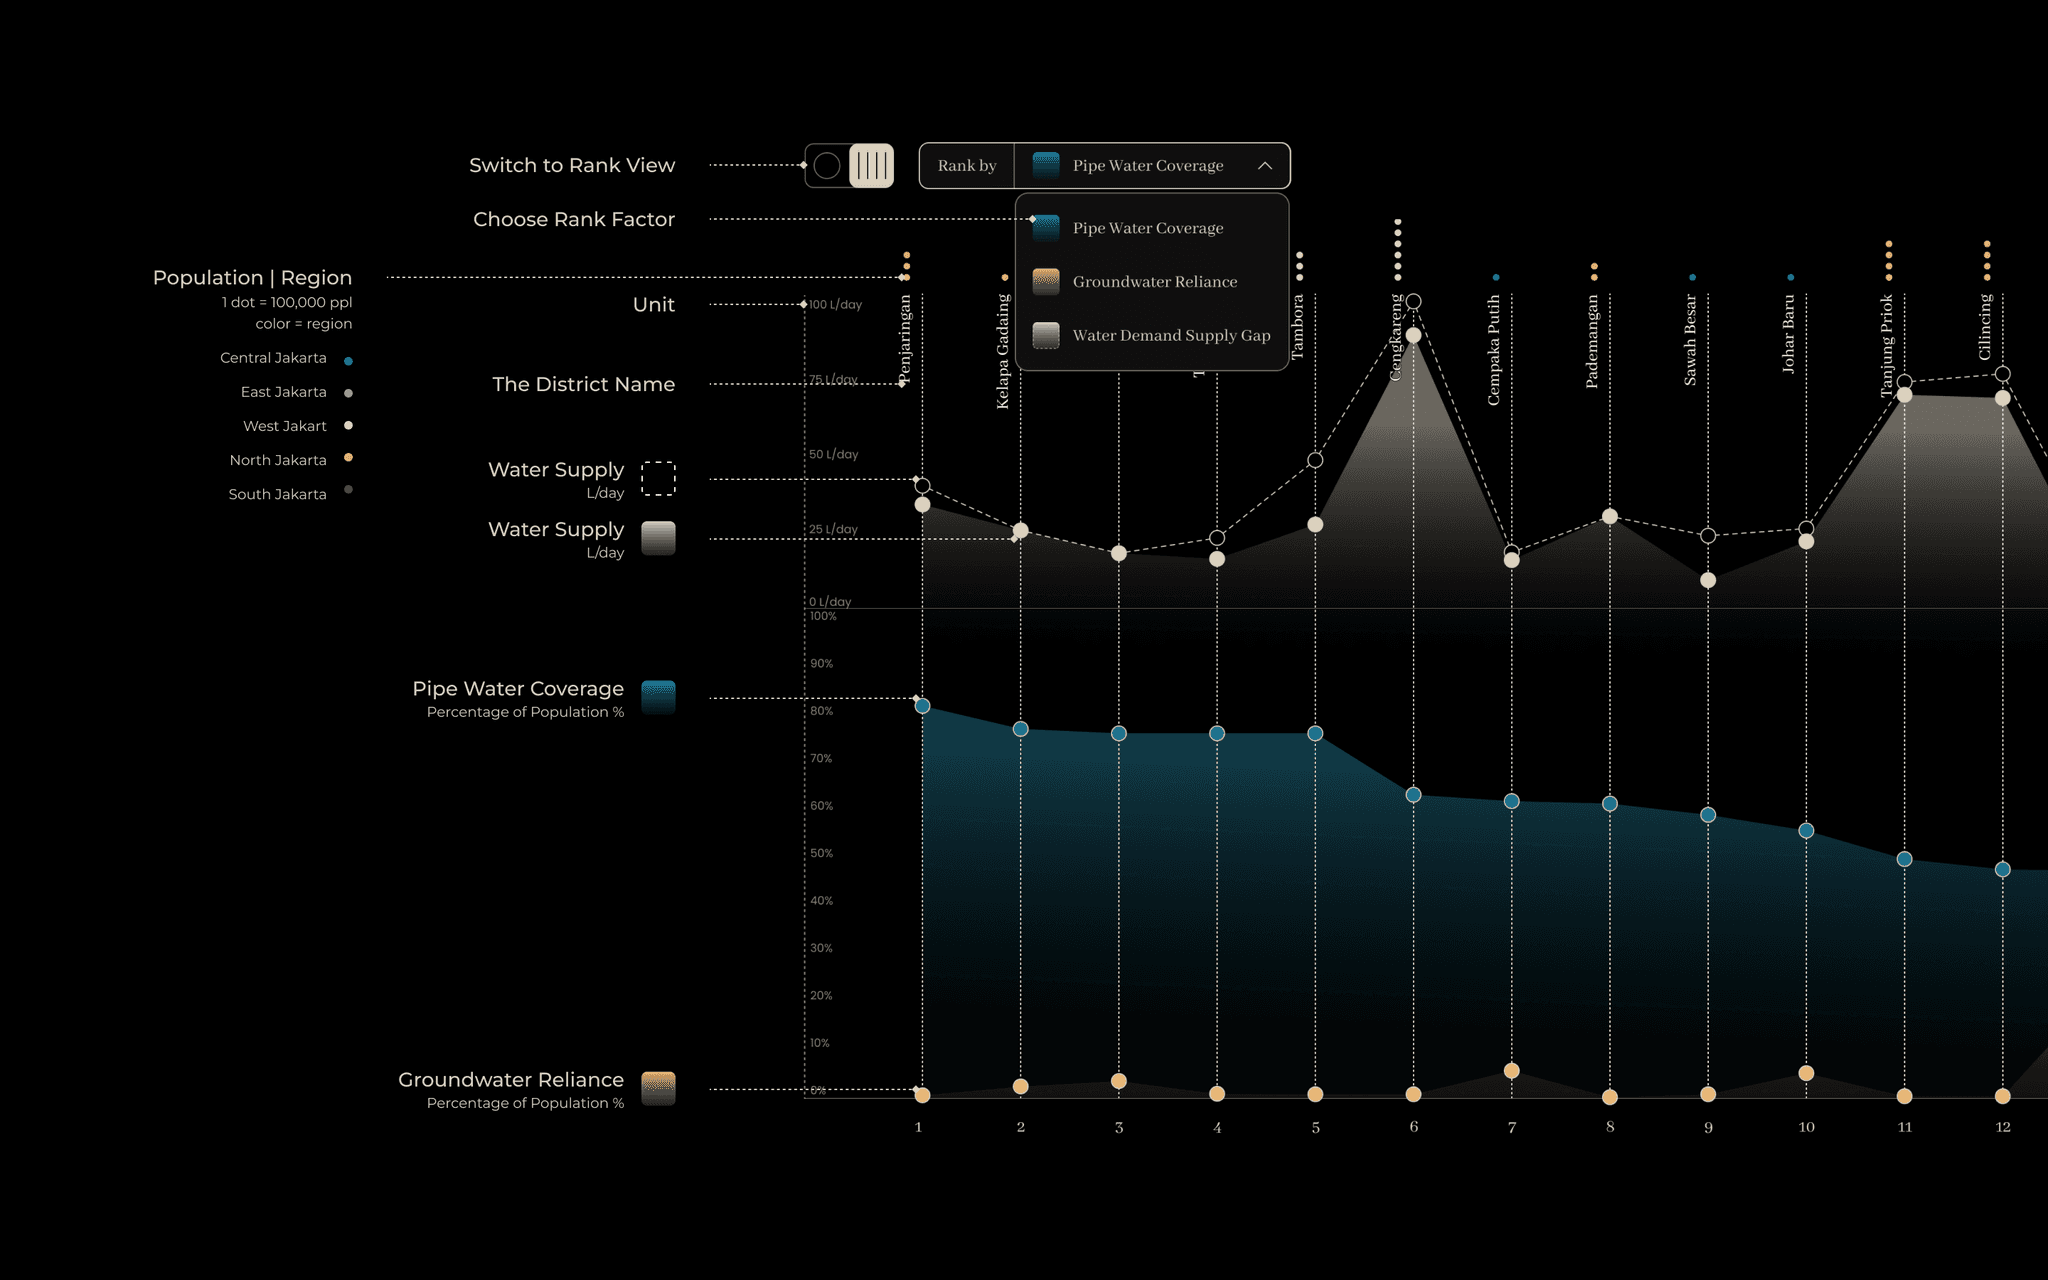
In the ranked view, users can select specific factors to rank districts, uncovering patterns and correlations across conditions to support data-driven decisions.
In the ranked view, users can select specific factors to rank districts, uncovering patterns and correlations across conditions to support data-driven decisions.
In the ranked view, users can select specific factors to rank districts, uncovering patterns and correlations across conditions to support data-driven decisions.
Linked Rank bar with the chart for intuitive navigation
Linked Rank bar with the chart for intuitive navigation
Linked Rank bar with the chart for intuitive navigation
Outcome
Empowered policymakers, businesses, and residents with data-driven insights for sustainable water management.
Empowered policymakers, businesses, and residents with data-driven insights for sustainable water management.
Empowered policymakers, businesses, and residents with data-driven insights for sustainable water management.
Provided easy access to 20+ data points on water distribution, consumption, and risks across 44 districts and 267 subdistricts
Provided easy access to 20+ data points on water distribution, consumption, and risks across 44 districts and 267 subdistricts
Visualized correlations between factors like pipe water coverage, groundwater reliance, and risk levels, supporting targeted interventions.
Visualized correlations between factors like pipe water coverage, groundwater reliance, and risk levels, supporting targeted interventions.
Built a tool adaptable for other cities facing similar water management challenges.
Built a tool adaptable for other cities facing similar water management challenges.